TL;DR: Blood values are your most important early warning system. Twelve markers cover 80 % of the relevant questions — from hemoglobin to creatinine. Reference ranges show the normal, not the healthy: vitamin D under 30 nmol/l is deficient, optimal is 75 to 125. Test once a year, document context, aim for optimal values instead of just the norm.
This article does not replace medical advice — always consult a physician for abnormal results.
What blood values tell you
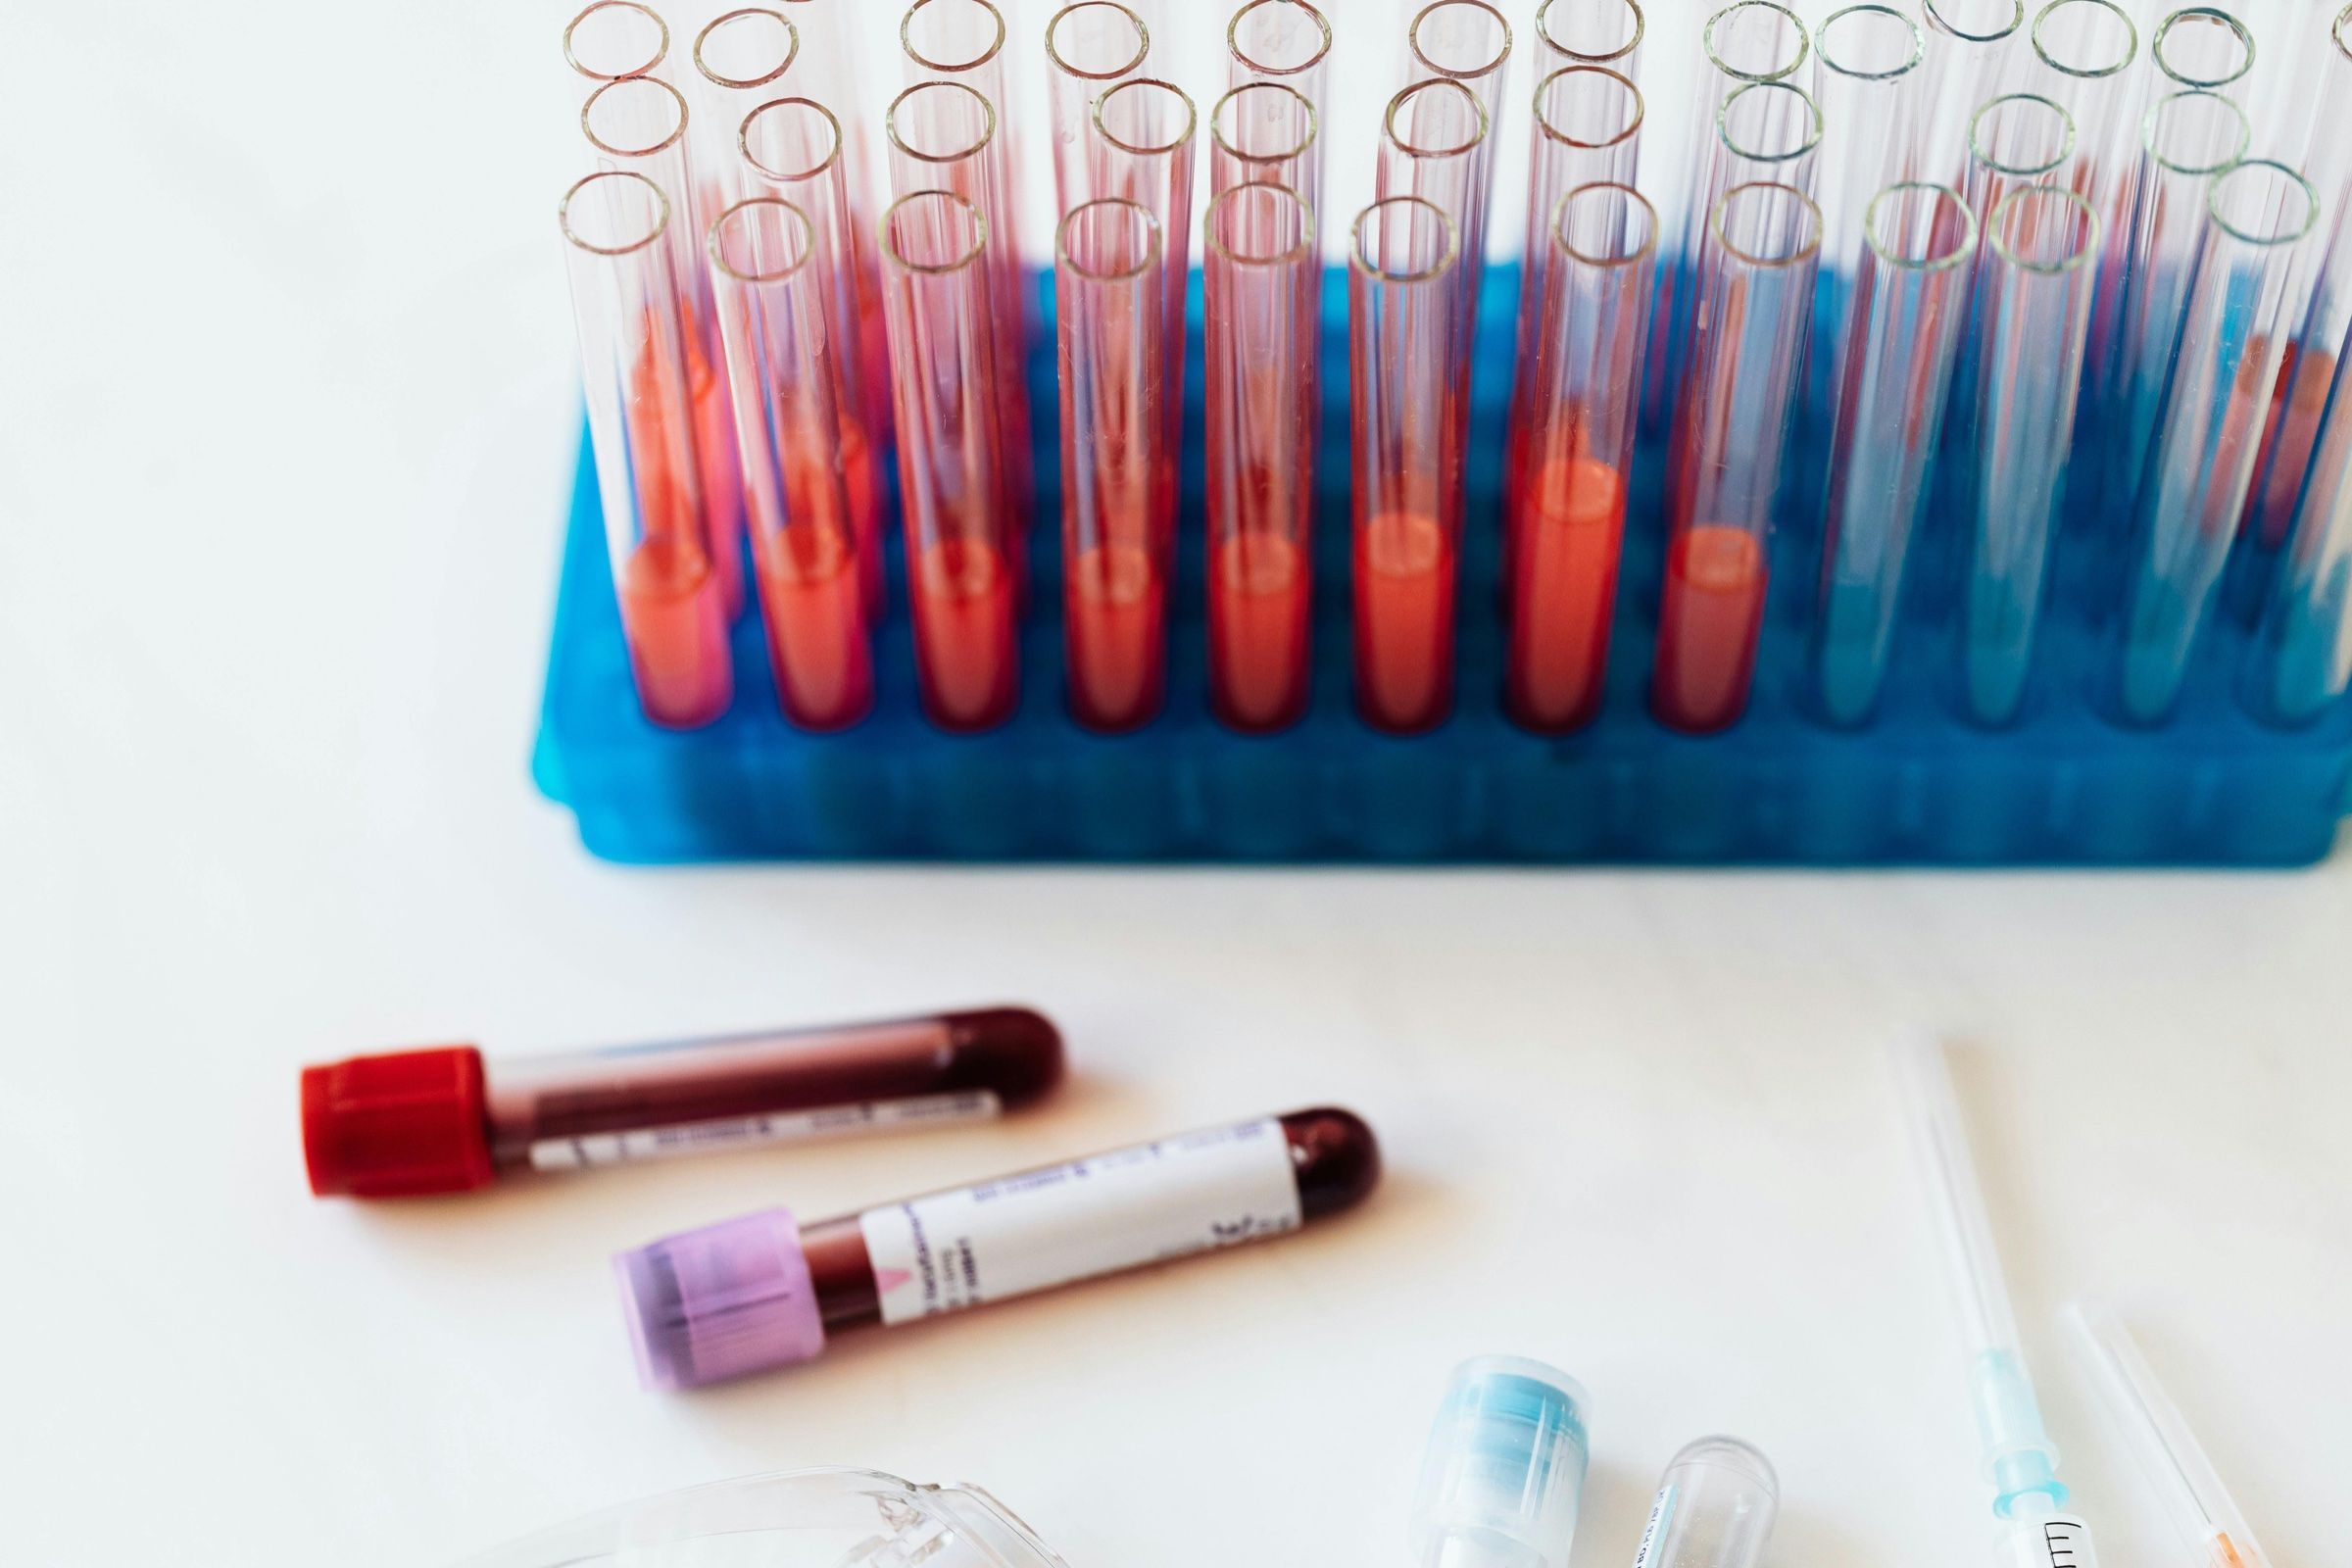
Your blood is a data store. In 10 ml of serum there is information about oxygen transport, blood sugar regulation, inflammation, liver and kidney function, hormone balance, and nutrient status. A single appointment with your doctor delivers 20 to 30 values — if you know which ones to order.
The problem: most lab reports end up unread in a drawer. The doctor says “all fine” — but what does that actually mean? A ferritin of 25 ng/ml is flagged as normal even though your iron stores are nearly empty. A TSH of 3.8 mIU/l sits inside the reference range even though you feel tired all day.
When you understand your own values, you make better decisions. You spot trends early and can course-correct with diet, sleep, training, or supplements. The first step is a clean baseline in 48 hours. The second is understanding the numbers.
The 12 most important blood values
This table is your reference card. Ranges come from German lab standards (2026), optimal values come from current studies on risk minimization.
| Marker | What it measures | Reference range | High means | Low means |
|---|---|---|---|---|
| Hemoglobin (Hb) | Oxygen transport in blood | Women 12–16 g/dl, men 14–18 g/dl | Dehydration, smoking, rare blood disorders | Anemia, iron or B12 deficiency |
| MCV (red cell volume) | Size of red blood cells | 80–96 fl | B12 or folate deficiency | Iron deficiency, chronic disease |
| Leukocytes | White blood cells, immune defense | 4–10 /nl | Infection, inflammation, stress | Viral infection, weak immune system |
| Platelets | Clotting | 150–400 /nl | Inflammation, post-surgery | Bleeding tendency, bone marrow issues |
| HbA1c | 3-month average blood sugar | Under 5.7 % normal, 5.7–6.4 % prediabetes | Insulin resistance, diabetes | Frequent hypoglycemia |
| Total cholesterol | Sum of cholesterol fractions | Under 200 mg/dl | Cardiovascular risk | Rarely relevant |
| LDL cholesterol | ”Bad” cholesterol | Under 116 mg/dl, optimal under 100 | Atherosclerosis risk | Rarely relevant under 40 |
| HDL cholesterol | ”Good” cholesterol | Women over 50, men over 40 mg/dl | Protective factor | Higher cardiovascular risk |
| Triglycerides | Dietary fats in blood | Under 150 mg/dl | Sugar, alcohol, fat excess | Rarely relevant |
| Vitamin D (25-OH) | Vitamin D stores | 75–125 nmol/l optimal | Overdosing, very rare | Bones, immunity, mood |
| Ferritin | Iron stores | Women 15–150, men 30–400 ng/ml | Inflammation, hemochromatosis | Iron deficiency, fatigue, hair loss |
| TSH | Thyroid control hormone | 0.4–2.5 mIU/l, optimal 1.0–2.0 | Underactive thyroid | Overactive thyroid |
| CRP | Inflammation marker | Under 3 mg/l normal, under 1 optimal | Acute inflammation, chronic risk | No negative finding |
| Creatinine | Kidney function | Women 0.5–0.9, men 0.7–1.2 mg/dl | Kidney weakness, dehydration | Muscle loss, rarely relevant |
That is 14 markers — I count HDL and LDL as separate values because they carry different messages. For a beginner this panel is enough. Later you can expand deliberately: homocysteine, free T3 and T4, insulin, apolipoprotein B.
Reference range vs. optimal value
This is the most important point in the guide. The reference range describes where 95 % of the population sits — it is statistical, not biological. If 30 % of the population has a vitamin D deficiency, the lower reference limit shifts down with them. “Normal” becomes a synonym for “common”, not “healthy”.
The optimal value comes from studies asking about the lowest disease risk. Vitamin D: the reference range starts at 30 nmol/l, but most studies show the lowest risk for infections, fractures, and cancer between 75 and 125 nmol/l. TSH: the reference range goes up to 4.0 mIU/l, but people with a TSH above 2.5 report fatigue and weight gain more often.
Practical rule: aim for optimal values, use the reference range as an alarm limit only. If your ferritin is 35 ng/ml, you are “normal” but not optimal. Target for women: above 50 ng/ml, for men above 100 ng/ml. A value can sit inside the reference range and still demand action.
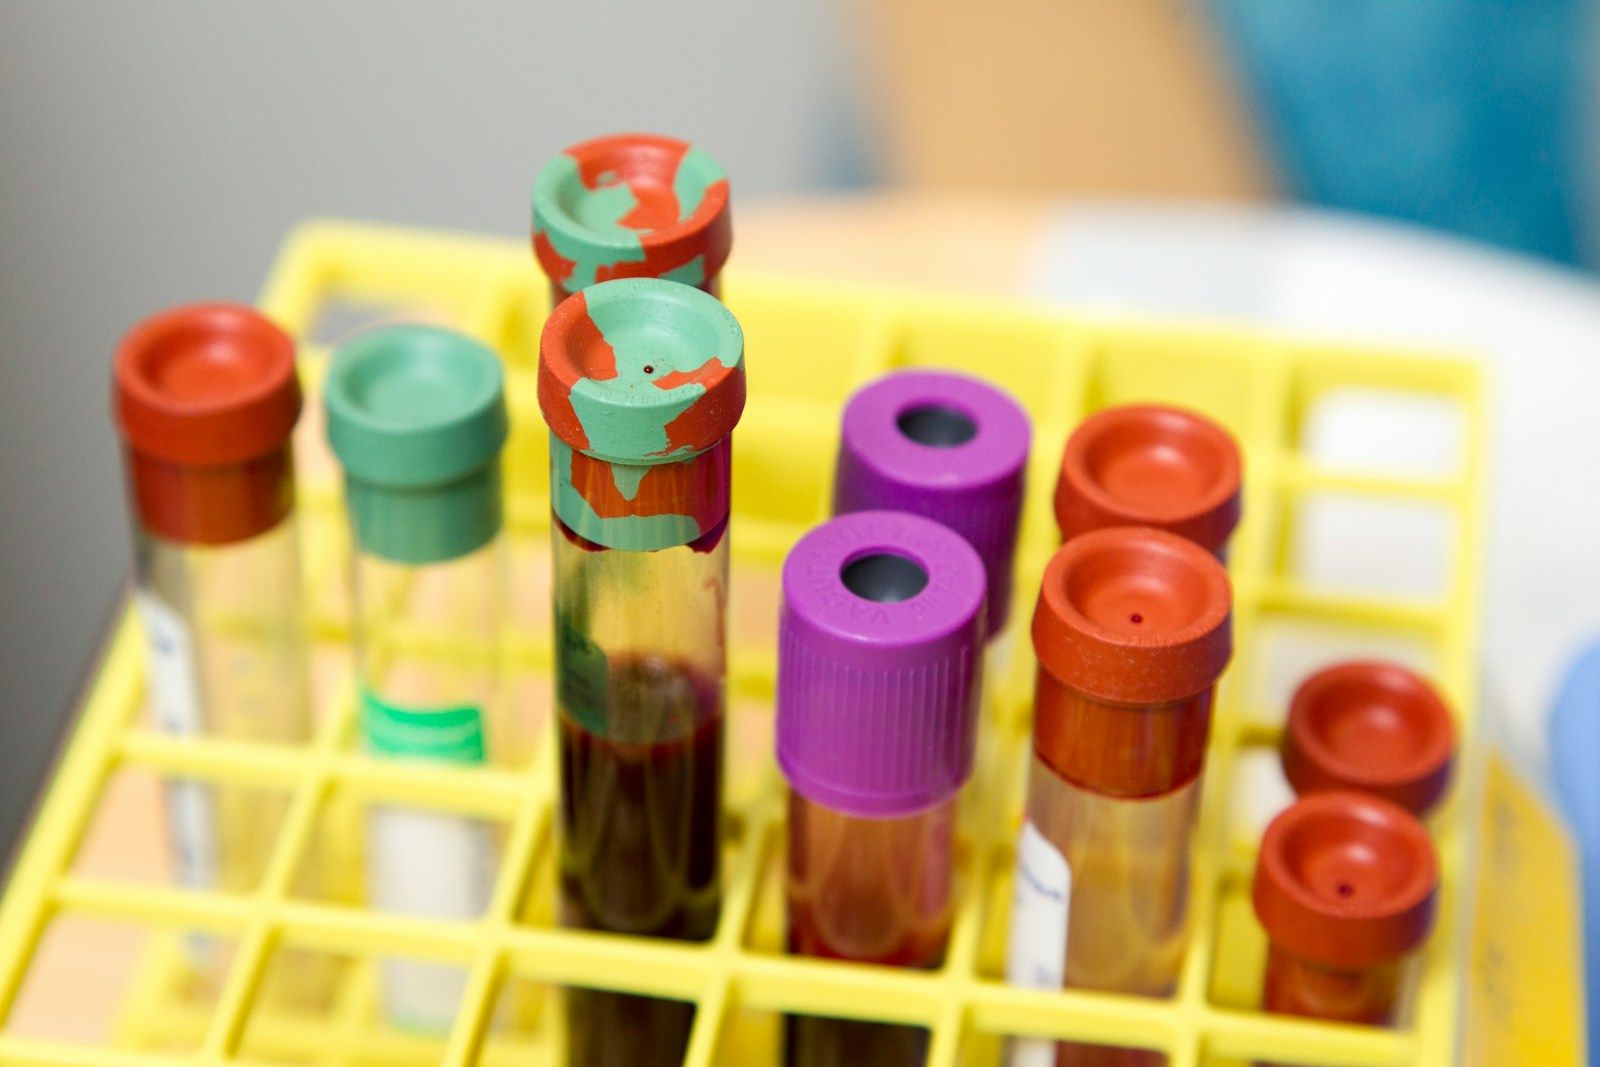
How to prepare for a blood draw
Preparation decides how meaningful your values are. Small mistakes can distort single markers by 20 to 40 %. Stick to these five steps:
- Fast for 12 hours: nothing to eat, only water or black coffee without milk. For lipids and blood glucose this is mandatory.
- Pause supplements for 48 hours: especially biotin (distorts thyroid values), iron (briefly raises ferritin), vitamin D, and adaptogens.
- No intense training 24 hours before: creatine kinase and CRP rise sharply after hard workouts.
- Morning between 7 and 9 am: cortisol, TSH, and testosterone follow a daily rhythm. Comparability only works inside a consistent time window.
- Document context: sleep quality, stress level, cycle day, last meal, current medication. Without context later comparisons fall apart.
A concrete example: your friend measures her ferritin after a hard workout — the value reads 80 ng/ml. A week later, at rest, it sits at 45. The first number was artificially raised by training-induced inflammation. Without context she would have made the wrong call.
Common mistakes when interpreting values
Five mistakes keep showing up in my practice. Avoid them and you will make the right call 90 % of the time.
Mistake 1: overvaluing single readings. A single measurement is always a snapshot, not a movie. A CRP of 5 mg/l after a rough night tells you nothing about your chronic inflammation risk. Only three measurements 4 to 6 weeks apart reveal the trend.
Mistake 2: mistaking the reference limit for a target. The upper reference limit is not your goal — it is the alarm line. An HbA1c of 5.6 % is “normal” but already edging toward prediabetes. Target values under 5.2 %.
Mistake 3: ignoring units. Vitamin D is measured in nmol/l or ng/ml. 30 ng/ml equals 75 nmol/l. If you compare a German lab report to an American study you must convert. Ferritin, cholesterol, and creatinine have similar pitfalls.
Mistake 4: ignoring context. Cortisol at 8 am is twice as high as at 4 pm. If you compare values from different times of day you are comparing apples and oranges. The same applies to cycle day, stress, and training.
Mistake 5: no time series. Anyone who files lab reports in a drawer after the doctor visit throws away 80 % of the value. The most important information is not the current number — it is the trend. Long-term biomarker tracking reveals patterns single readings never show.
Tracking for the long run
Blood values are not an exam where only the final grade matters. They are a sensor that travels with you through time. Your vitamin D in January is a different value from your vitamin D in July. Your ferritin after a diet change shows whether the intervention works. Your HbA1c over two years tells you whether your lifestyle holds up.
You need a system for this. A paper folder works but is painful. A spreadsheet is better but tedious to maintain. A digital lab archive like Lab2go is the next step: you upload the report as PDF or photo, the app extracts the values automatically and visualizes trends. Reference ranges and optimal targets are built in, context tags take a few seconds.
Start today. At your next doctor visit, order the 14 markers from the table above, prepare with the five steps, and document everything digitally. After three measurements you have a trend, after twelve months a solid base for decisions. For implementation check the Lab2go features or compare plans and pricing. If you want to go deeper, the Health Analytics Blueprint maps the full data stack. For quality-checking your supplements, the Supplement Quality Audit is a good starting point, and for your monitoring setup see Connected Health Dashboards.
One last note: this article does not replace medical advice. For abnormal values or symptoms always consult a physician. Self-tracking complements medicine — it does not replace it.
Article FAQ
- What are the most important blood values for healthy adults?
- Twelve markers cover 80 % of the relevant questions: hemoglobin, MCV, leukocytes, platelets, HbA1c, total cholesterol, LDL, HDL, triglycerides, vitamin D (25-OH), ferritin, TSH, CRP, and creatinine. These values give you status on oxygen transport, blood sugar, lipid metabolism, inflammation, kidney and thyroid function. A complete blood count plus this panel is enough for a first baseline.
- How often should I get blood work done?
- Once per year is the baseline recommendation for healthy adults under 40. Above 40 or with family history (cardiovascular, diabetes, thyroid), measure every 6 months. After an intervention — a new diet, a supplement stack, a medication change — wait 8 to 12 weeks before retesting so values can settle.
- How much does a complete blood panel cost?
- A standard complete blood count costs 15 to 30 euros out of pocket in Germany. An extended panel with vitamin D, ferritin, HbA1c, thyroid, and lipids ranges from 80 to 180 euros. Online labs (Cerascreen, Medivere, Thriva in the UK) charge 90 to 200 euros for comparable panels. Statutory health insurance only covers these tests when there is a medical indication.
- What does 'slightly elevated' mean for blood values?
- Slightly elevated means the value sits above the upper reference limit but below the clinically concerning range. A CRP of 4 mg/l is slightly elevated (norm under 3) but not dramatic. The trend matters most: if the value keeps rising across three measurements, it deserves a closer look. Single outliers often come from infection, poor sleep, or intense training.
- How does the reference range differ from the optimal value?
- The reference range shows where 95 % of the population sits — it describes the normal, not the healthy. The optimal value comes from studies on the lowest disease risk. Vitamin D: reference starts at 30 nmol/l, optimal is 75 to 125 nmol/l. TSH: reference 0.4 to 4.0 mIU/l, optimal 1.0 to 2.0. Aim for optimal values, not just the norm.
- Do I need to fast before a blood draw?
- For glucose, HbA1c, insulin, triglycerides, and the lipid panel you should fast 12 hours. Water and black coffee without milk are fine. For complete blood count, liver, kidney, and thyroid values fasting is not mandatory but helpful for comparability. Pause supplements 48 hours before the draw — especially biotin, iron, and vitamin D.
- Which blood values matter most for women?
- Ferritin is the most important value for women of reproductive age. If ferritin is below 30 ng/ml, iron stores are empty — even if hemoglobin still looks normal. Other priorities: TSH and fT3/fT4 (thyroid issues are 5 times more common in women), vitamin D, vitamin B12, and folate. In perimenopause, add FSH, estradiol, and progesterone.
- What should I do when values look abnormal?
- Three steps. First, do not panic — a single outlier is not a diagnosis. Second, retest after 4 to 8 weeks, ideally at the same lab under the same conditions. Third, consult your doctor or a specialist if the abnormality persists. Always document context: sleep, stress, training, and any infections over the past 2 weeks.
- Can I track my blood values myself?
- Yes — and you should. A digital lab archive reveals trends that single reports never show. In Lab2go you upload lab results as PDF or photo, the app extracts values automatically and visualizes time series. This is how you notice that your ferritin drops over 6 months or your HbA1c slowly climbs before it becomes clinically relevant.
- Which blood values indicate a nutrient deficiency?
- Six values cover the most common deficiencies: ferritin (iron), 25-OH vitamin D (vitamin D), vitamin B12 or holo-transcobalamin (B12 stores), serum folate, whole-blood magnesium (serum is too imprecise), and serum zinc. For a complete picture add copper, selenium, and urinary iodine. A typical deficiency panel costs 120 to 200 euros out of pocket.
This article is for general information only and is not a substitute for individual medical advice, diagnosis, or treatment. Discuss any changes to your diet, supplementation, or medication with a qualified healthcare professional.
Physician focused on preventive medicine, women's health, and connected diagnostics.
Areas of focus
Discussion
Community comments coming soon. Until then, we welcome feedback and questions via email.
E-Mail anzeigen